
We can (and do) discuss online retailing till the cows come home. However, at such times, there’s one thing we cannot do; and that is ‘generalise’. If you want to understand what’s happening with online retailing you need to categorise. Tony Dimasi explains…
Australia Post’s comprehensive 2024 e-commerce industry report titled Inside Australian Online Shopping estimates that Australian consumers spent $63.6 billion on retail goods in 2023. The estimate is attributed to CommBank iQ consumer spend and online transactions data, more of which a little later.
What is interesting about this estimate is that it is virtually identical – indeed marginally lower – than the estimate provided in Australia Post’s 2023 E-commerce Industry Report which was $63.8 billion. In other words, there was no growth in total online retail spending by Australians in calendar year 2023.
This picture – of little or no growth – is also supported by the Australian Bureau of Statistics (ABS) which provides its own estimates of online retail turnover. The ABS estimates, however, are restricted to Australian retail businesses, thus they understate the total amount spent online by Australian consumers since they do not include online purchases from overseas businesses. The ABS estimates, which are published in the bureau’s Monthly Retail Trade, Australia publication, show that in 2023 total online retail trade for Australian businesses was $45.7 billion, while in 2022 the figure was $44.4 billion, an increase of about 3% in 2023.
Both data sources show that to the extent that growth occurred in online retail spending by Australian consumers in 2023, that growth was restricted to online food retailing, with non-food online purchases being flat or falling slightly.
The elevated level of online retail spending that occurred during the COVID period has therefore consolidated but has not continued to increase. The ABS Retail Trade data shows that physical store sales in 2023 increased by about 3.2%, a figure marginally higher than the increase recorded in its estimate of online sales.
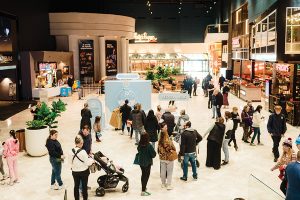
So, it is fair to say that the physical store has hit back after the COVID setbacks. There is now little doubt that the attractions of physical shopping, not least the social interaction involved, are attributes that consumers continue to value highly. It is up to retailers and their physical store presentations and offers to ensure that they reward that loyalty by providing physical store experiences that continue to engage consumers. If that is the case, then the physical store will again be set for a period of steady growth as the Australian economy begins to move beyond the high interest rate/high inflation period that has been the case throughout the past few years.
These are the high-level trends that we are now seeing with online retail spending behaviours by Australians, but what about more granular details? What are the drivers of online shopping behaviours and why do we see such significant variations in some categories versus others?
The CommBank iQ data referred to earlier leverages Australia’s largest aggregated and de-identified transactional banking dataset and can provide rich insights into consumers’ real spending behaviours. This includes identifying purchases made online from both Australian and international retailers.
The granular insights that are available from the CommBank iQ data can be accessed via the GapMaps platform, which provides a spatial picture of retail spending by category and detailed sub-category across Australia – both in-store and online. The data, therefore, can be analysed by category and geography to provide an extraordinary level of understanding and insight into what is happening in the online retail world.
As an example, at a national level, the data shows that total online retail expenditure accounts for approximately 16% of the total retail expenditure of Australians but varies from ratios as high as 47% for the leisure category (which includes online streaming and entertainment, books and print media, music, computer and games stores) to only about 1.6% for fresh food retailers, excluding supermarkets. For supermarkets, despite both Woolworths and Coles being among the largest online retailers in Australia, the proportion of total purchases that is made via the online channel is still only about 6%. But the volume is significant because of the huge size of the supermarket category.
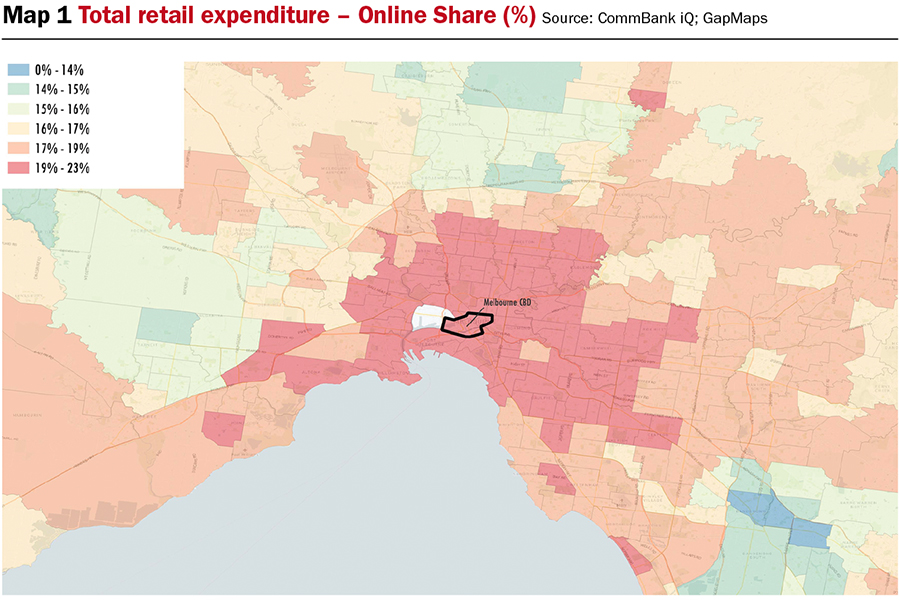
Map 1 provides insight on the total online expenditure patterns across Melbourne while Maps 2 and 3 focus on the very different patterns that apply in two specific categories, in this instance food catering (ie. F&B) and apparel shopping.
The proportion of total retail expenditure that is directed online by Australian consumers now tends to fall within a relatively narrow band, especially across metropolitan areas. Typically, the range is 15% to 23%, being higher in higher income areas – often, ironically, in the inner-city areas where residents enjoy the greatest levels of access to wide ranges of bricks-and-mortar shopping. In rural areas, the shares are lower but still significant, generally in the range of 12% to 15%.
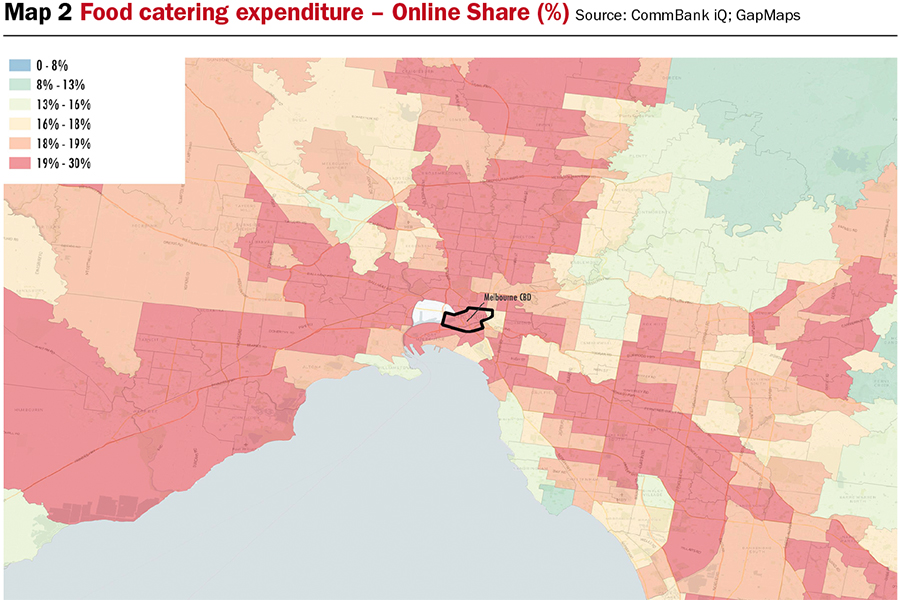
Food catering online spending is noticeably higher, as a category share, than total online retail spending, as shown on Map 2 (above). As is the case with total retail spending, though, the share of F&B spending directed online is quite consistent across major metropolitan areas. Extensive online purchasing in this category is now widespread both geographically and across varying socio-economic profiles, from the very high income, small household inner city residents to the low income, large young households in the outer growth areas. Of course, the fact that the real costs of delivery are rarely charged by the gig economy operators always trying to grow market share helps explain, at least in part, why this is the case.
Map 3 (below) is arguably the most interesting, highlighting wide variations in online shopping proclivities for the apparel category.

Generally, the ratios now being directed online in this category are much higher than most other categories but what is also evident is that there is noticeably greater variability, and that for this category income level tends to be a more important driver of online shopping than is the case in other categories.
So, the overall picture when it comes to online shopping is now arguably more settled than it has been for many years but there is so much going on below the surface that needs to be understood and appreciated by any operators wishing to optimise their strategies in both the physical and online spaces. In Australia, the availability of such robust data and insights as I have highlighted makes that understanding easily accessible.
This article by Tony Dimasi, GapMaps, is featured in the latest edition of SCN magazine.

Add comment